
Performance
Since 2002, GAO’s work has resulted in about $1.51 trillion in financial benefits for Congress and the American people. We produce a strategic plan, a performance plan, and an annual performance and accountability report with information comparable to that reported by executive-branch agencies. View all of our prior year reports, and read more about current reports below.
GAO’s 2027-2032 Strategic Plan
Every 4 years, GAO publishes a strategic plan for serving the Congress. Our Strategic Plan for 2027 to 2032 charts a course to meet the rapidly changing needs and priorities of Congress. The plan outlines how the agency will help Congress address emerging opportunities and challenges, including the rise of artificial intelligence, mounting fiscal pressures, and growing national security threats. The plan’s goals advance GAO’s mission to improve federal accountability and performance for the benefit of the American people.
Performance Plan
GAO's annual performance plan covers activities for each of our strategic goals and is included with our budget submission each year.
In the spirit of the Government Performance and Results Act, our annual performance plan informs the Congress and the American people about what we expect to accomplish on their behalf in the coming fiscal year. It sets forth our plan to make progress toward achieving our strategic goals for serving the Congress and the American people. This framework not only shows the relationship between our strategic goals and strategic objectives, but also show major themes that could potentially affect our work.
Performance and Accountability Report
In January 2026, GAO released our fiscal year 2025 Performance and Accountability Report, highlighting $62.7 billion in financial benefits for the federal government. GAO also recorded 1,295 non-financial benefits, driving operational improvements across federal programs including those dedicated to public safety, national security, and vulnerable populations such as children, veterans, and those with disabilities.
Image
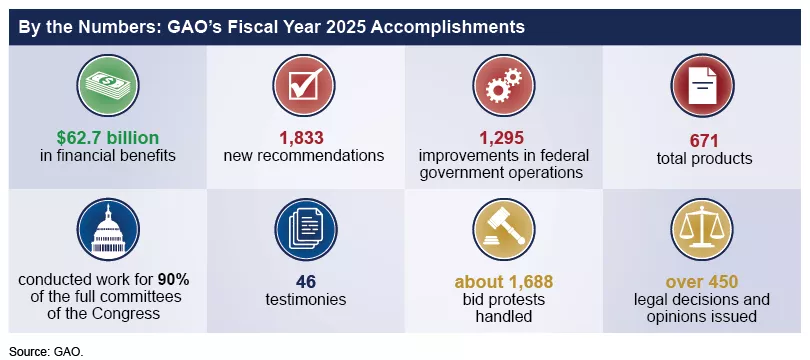
Table: Agency-wide Summary of Annual Measures and Targets
| Performance measure | 2020 actual | 2021 actual | 2022 actual | 2023 actual | 2024 actual | 2025 target | 2025 actual | Met/ not met | 2026 target |
|---|---|---|---|---|---|---|---|---|---|
| Results | |||||||||
| Financial benefits (dollars in billions) | $77.60 | $66.20 | $55.60 | $70.40 | $67.50 | $50.00 | $62.70 | Met | $50 |
| Other benefits | 1,332 | 1,239 | 1,262 | 1,220 | 1,232 | 1,200 | 1,295 | Met | 1,200 |
| Past recommendations implementeda | 77% | 76% | 77% | 75% | 70% | 80% | 77% | Not met | 80% |
| New products with recommendations | 64% | 58% | 64% | 63% | 63% | 60% | 62% | Met | 60% |
| Client | |||||||||
| Testimonies | 59 | 67 | 72 | 57 | 60 | 90 | 46 | Not met | 90 |
| Timeliness | 93% | 97% | 97% | 94% | 100% | 90% | 98% | Met | 90% |
| People | |||||||||
| New hire rate | 76% | 80% | 76% | 81% | 83% | 80% | 89% | Met | 80% |
| Retention rate, with retirements | 95% | 96% | 93% | 95% | 95% | 92% | 96% | Met | 92% |
| Retention rate, without retirements | 97% | 98% | 97% | 96% | 97% | 96% | 98% | Met | 96% |
| Staff development | 81% | 82% | 82% | 79% | 81% | 80% | 84% | Met | 80% |
| Staff utilization | 85% | 85% | 84% | 86% | 85% | 80% | 87% | Met | 80% |
| Experience with supervisors | 90% | 91% | 90% | 90% | 91% | 82% | 90% | Met | 82% |
| Organizational climate | 86% | 87% | 86% | 86% | 86% | 80% | 88% | Met | 80% |
| Internal operations | |||||||||
| Help get job done | N/Ab | N/Ab | 78% | 78% | 79% | 80%c | N/Ac | Not metd | N/Ac |
| Quality of work life | N/Ab | N/Ab | 81% | 81% | 78% | 80%c | N/Ac | Not metd | N/Ac |
| IT tools | N/Ab | N/Ab | 61% | 65% | 72% | 80%c | N/Ac | Not metd | N/Ac |
Note: Information explaining all of the measures included in this table appears in the FY 2025 Performance and Accountability Report.
a Starting in FY 2025, we used a 5-year implementation rate to calculate the percentage of past recommendations implemented.
b Not Applicable. In 2022, we administered a new survey instrument to better gauge the quality of our internal customer services; the new survey instrument established a new trend baseline for these measures.
c Not available. We administer our annual customer survey in January to gauge the customer experience for the prior calendar year and report the results in the next fiscal-year PAR. Calendar year 2025 data will be provided in the FY 2026 PAR.
d Our “Met/not met” status is based on calendar year 2024 data.
Performance and Accountability Reports
Peer Reviews
Independent organizations perform a peer review of GAO’s system of quality control for work done under generally accepted government auditing standards to determine whether it is suitably designed and operating effectively. For the most recent review, the international peer review team provided the highest possible rating to the U.S. Government Accountability Office (GAO) on its quality assurance program.
The peer review includes an assessment of GAO’s quality assurance policies, interviews with our management and staff, a compliance assessment of a sample of performance and financial audits, and in-depth analyses of three performance audit engagements.