Federal Workforce: Data Reveal Minor Demographic Changes 2011-2021
Fast Facts
The federal government aims to hire and promote a workforce that reflects the diversity of the U.S. population.
We looked at a decade of federal employment trends. For example, from 2011-2021 there were minor changes in the representation of historically disadvantaged racial groups—like Black or African American and Asians—in the federal workforce. But several of these groups made gains in senior executive service positions.
The percentage of Hispanic federal workers also increased. But in FY 2021, Hispanic individuals made up 10% of the federal workforce, even though they represented 18% of the civilian labor force.

Highlights
What GAO Found
From fiscal years (FY) 2011 through 2021, there have been minor increases in representation in the federal workforce of people who are Black or African American, Asian, Native Hawaiian or other Pacific Islander, American Indian or Alaska Native, and persons of more than one race (see figure). Overall, in FY 2021, representation for historically disadvantaged racial groups in the federal workforce was higher than that in the 2021 civilian labor force.
Participation in the Federal Workforce by Race

Note: Native Hawaiian or other Pacific Islander increased from 0.4 percent to 0.6 percent, American Indian or Alaska Native stayed at 2 percent, and people of more than one race increased from 1.1 percent to 2.8 percent.
The percentage of Hispanic employees in the federal workforce increased by 1.4 percent from FY 2011 to 2021. However, in FY 2021, federal representation of Hispanic employees was less than the civilian labor force.
Hispanic Participation in the Federal Workforce Compared to Civilian Labor Force

Also during FY 2011 to 2021, the proportion of women in the federal workforce remained relatively stable. However, in FY 2021, their representation was less than that in the civilian labor force.
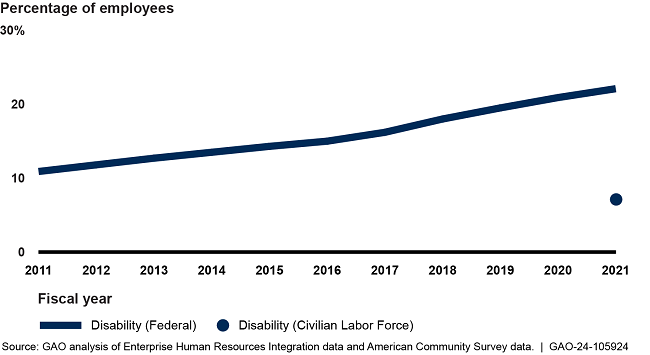
During FY 2011 to 2021, the representation of persons with disabilities in the federal workforce doubled and was about three times that of the representation in the FY 2021 civilian labor force.
Participation of People with Disabilities in the Federal Workforce Compared to the Civilian Labor Force
Additionally, men and women in each historically disadvantaged racial group and White women made positive gains in Senior Executive Service positions from FY 2011 to 2021 (with the exception of the Native Hawaiian or other Pacific Islander group). Historically disadvantaged groups were generally hired, promoted, and separated at higher rates in FY 2021 than in FY 2011.
Why GAO Did This Study
For years, federal leaders have highlighted the importance of fostering an inclusive workforce that reflects the diversity of the United States. Federal law prohibits discrimination against federal employees and in federal programs on the basis of race, religion, color, national origin, sex, disability, and age. Federal agencies operate equal employment opportunity programs to help ensure a fair workplace and proactively prevent employment discrimination. Issued in June 2021, Executive Order 14035 required agencies to issue new plans for diversity, equity, inclusion, and accessibility, and to hire and promote a workforce that reflects the diversity of the American public.
GAO was asked to analyze demographic trends in the last decade across the federal workforce. This report describes the changes to the demographics of the federal workforce during FY 2011 through 2021 in terms of race, ethnicity, age, gender, and disability.
To address this objective, GAO analyzed federal workforce data from the Office of Personnel Management's Enterprise Human Resources Integration database for FY 2011 through 2021—the most recent data available at the time of the analysis. GAO used these data to identify the racial and ethnic composition of the federal workforce over the time period. GAO also used demographic data from the Census Bureau to draw comparisons with the broader national civilian labor force.
For more information about this report, contact: Dawn G. Locke, (202) 512-6806 or locked@gao.gov.