USDA Market Facilitation Program: Stronger Adherence to Quality Guidelines Would Improve Future Economic Analyses
Fast Facts
Foreign trade partners retaliated for increased U.S. tariffs in 2018—reducing U.S. exports of certain agricultural commodities. USDA gave affected farm producers $23 billion in 2018 and 2019 to compensate for lost exports.
But we found that, for 2019, the way that USDA estimated the value of lost exports resulted in higher payments. This is because, for commodities such as wheat, the baseline export values USDA used were inappropriately high.
Also, the way USDA distributed payments led to producers in different regions receiving different payments for the same crop.
We recommended better reviews and greater transparency in USDA analyses.

Highlights
What GAO Found
The U.S. Department of Agriculture's (USDA) 2018 and 2019 Market Facilitation Programs (MFP) provided payments to help farm producers affected by foreign retaliatory tariffs. In its estimation of the effect of these foreign actions on farm producers (i.e., trade damages), USDA addressed several key elements of an economic analysis. For example, USDA assessed the sensitivity of its analysis to alternative assumptions. However, for the 2019 MFP, USDA used baselines that did not best represent what trade would be absent the retaliatory tariffs, and that increased trade damage estimates.
Trade damage estimates. USDA used an economic model to estimate the percentage that U.S. exports of each eligible commodity to retaliating countries would decline due to retaliatory tariffs. The model used trade data and academic sources for the value of parameters—known as elasticities—that estimate how foreign importers would respond to price changes. USDA then multiplied the percentage decline by a baseline of past exports to calculate trade damages.
For the 2018 MFP, USDA used a justifiable baseline, the value of retaliating country imports from the U.S. of an eligible commodity in 2017, the year before retaliatory tariffs. For example, USDA estimated that China imports of U.S. wheat would decline by 61 percent due to retaliatory tariffs and applied that decline to the $391 million value of 2017 trade, producing a trade damage estimate of $238 million. For the 2019 MFP, USDA policymakers requested baseline options from OCE and chose to base trade damages on a baseline OCE calculated as a sum of the highest retaliating country imports in any year from 2009-2018 of each product defining the commodity. As a result, USDA used unrepresentative baselines equal to or higher than the highest value of retaliating country imports in any one year. For example, in 2013, China imports of U.S. durum wheat were $182 million and of “other wheat” were at their highest ($1.1 billion)—a total of $1.3 billion. In 2017, China imports of U.S. “other wheat” were lower but durum wheat was at its highest, $289 million. USDA's 2019 MFP wheat baseline summed the two separate highest values and exceeded $1.3 billion. USDA used the new baseline and the same estimated 61 percent decline to calculate 2019 MFP wheat trade damage of $836 million—more than three times the 2018 MFP estimate and more than twice the 2017 value of China imports of U.S. wheat.
USDA 2019 MFP Baseline and Nominal Value of Chinese Imports of U.S. Wheat, 2009-2018
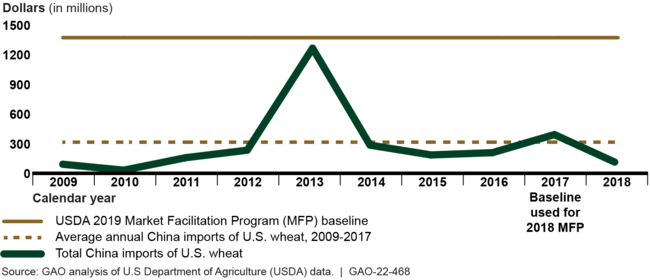
For 14 of the 29 MFP-eligible commodities USDA analyzed, USDA's 2019 MFP baseline was higher than the highest value of retaliating country imports from the U.S. in any one year from 2009 through 2018. USDA officials said USDA's baseline methodology treated commodities equitably and was responsive to concerns expressed about the 2018 MFP baseline by attempting to account for policy factors such as nontariff barriers that may have been in place at different points, making it difficult to identify a single baseline. In addition to using unrepresentative baselines, USDA did not transparently document its 2019 MFP baseline methodology or selection of elasticity values.
The limitations in USDA's economic analyses occurred even though USDA conducted an internal review designed to ensure it adhered to Information Quality Guidelines requiring sound analytical methods and transparency to the extent possible. As a result, USDA increased its 2019 trade damage estimates in a manner that was not transparent to decision makers and the public.
Payments. USDA's methodology for calculating 2019 MFP payments addressed some limitations of its 2018 methodology but resulted in (1) producers of the same nonspecialty crop (such as corn and soybeans) being paid differently in different counties, and (2) total payments for a nonspecialty crop different from USDA's estimate of trade damage to the crop. USDA's 2018 approach—dividing each commodity's trade damage estimate by its 2017 production—ensured the payments were proportional to trade damages, but excluded indirectly affected nonspecialty producers. In 2019, seeking to address this limitation and avoid influencing planting decisions, USDA calculated separate payment rates per acre for each county and paid the same rate to all nonspecialty producers in the county. USDA calculated each county's rate as its weighted average trade damage per acre—dividing the county's total trade damage to multiple eligible nonspecialty crops by the county's historical acres of eligible crops.
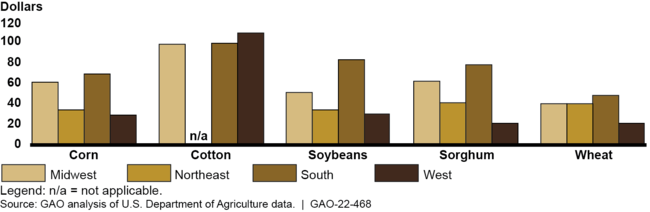
USDA's county-based payment methodology for the 2019 MFP resulted in different payment rates for producers of the same nonspecialty crop in different counties. For the 2019 MFP, a county's crop mix (i.e., what others in the county planted) affected the payment rate. USDA paid higher rates to producers of a crop in a county where others planted crops with higher trade damages per acre than it paid producers of that same crop where others planted crops with lower trade damages per acre. Crop payment rates were generally higher in the South because of the South's higher proportion of cotton, sorghum and soybeans, which had higher trade damages per acre. For example, though corn yields are higher in the Midwest and West, corn producers received an estimated average of $69 per acre in the South, $61 in the Midwest, $34 in the Northeast, and $29 in the West. USDA used minimum and maximum county rates to help address potential inequities, but regional differences remained.
Estimated Average County Per-Acre Payment Provided by the 2019 Market Facilitation Program by Region for Selected Nonspecialty Crops
Because USDA decoupled an individual nonspecialty crop's trade damage and its payment rate, USDA provided total payments to a nonspecialty crop higher or lower than the crop's estimated trade damage. GAO estimated that, for example, total 2019 MFP payments to corn producers were approximately $3 billion more than USDA's estimate of trade damage to corn, while payments to soybeans, sorghum, and cotton producers were lower than their estimated trade damages.
Why GAO Did This Study
In 2018, the President, citing national security concerns in one action and unfair foreign trade practices in another, increased tariffs on certain imported products. Affected trade partners retaliated with tariffs targeting U.S. exports. USDA's 2018 MFP and 2019 MFP provided a total of $23 billion to address the effect of foreign trade actions on U.S. agricultural producers.
GAO was asked to review USDA's methods for estimating trade damages and providing payments to producers. This report examines (1) the extent to which the methodologies USDA used to estimate trade-related damages for the 2018 MFP and 2019 MFP addressed key elements of an economic analysis, and how those methodologies affected the estimates, and (2) strengths and limitations of the methodologies USDA used to calculate payments for the 2018 MFP and 2019 MFP and how the methodologies affected the payments. GAO reviewed USDA's documentation, data and calculations, and written responses from USDA.
Recommendations
GAO is making two recommendations to USDA that the Office of the Chief Economist (OCE) revise its internal review processes to ensure that future economic analyses provide documentation that transparently describes the methodologies and use representative baselines. OCE disagreed, stating that its role was to inform policymakers, who determined the baseline and program design. GAO continues to believe that transparently describing its methodology and providing representative baselines will help OCE improve future economic analyses, as discussed in the report.
Recommendations for Executive Action
| Agency Affected | Recommendation | Status |
|---|---|---|
| Department of Agriculture | The Secretary of Agriculture should ensure that the Office of the Chief Economist revises its internal review process to help ensure that USDA internal reviews of future economic analyses address the transparency of its documentation of the analyses. (Recommendation 1) |
In June 2022, and again in September 2023, USDA reiterated that it disagreed with our recommendations. USDA stated that the Office of the Chief Economist (OCE) conducted the analysis in accordance with USDA Information Quality Guidelines and published the data sources, methodology, and assumptions underlying the analysis in two methodology reports posted to the OCE website and in the rulemaking Cost Benefit Analysis. However, OCE's published documentation did not transparently describe, to the extent possible, the 2019 MFP baseline methodology or OCE's selection of the elasticity values used in its economic model from among the available estimates, as USDA Information Quality Guidelines require. In February 2024, USDA OCE stated that it had not revised, and did not have plans to revise, its internal review process to ensure the documentation of its analysis is transparent since the publication of GAO's report in November 2021. GAO contacted USDA regarding the status of this recommendation in March 2025 and March 2026 but has not received a response.
|
| Department of Agriculture | The Secretary of Agriculture should ensure that the Office of the Chief Economist revises its internal review process to help ensure that USDA internal reviews assess whether future economic analyses use representative baselines. (Recommendation 2) |
In June 2022, and again in September 2023, USDA reiterated that it disagreed with our recommendations. USDA stated that GAO's findings with respect to the 2019 baseline and payment levels do not take into account that USDA policy makers, not the Office of the Chief Economist (OCE), made those determinations. However, though OCE did not make the policy decision, it provided options to policy makers that directly affected the program spending levels and payment rates, and we found that OCE's analysis did not meet USDA Information Quality Guidelines. OCE presented an option to policymakers that relied on an unrepresentative baseline for the 2019 MFP. In February 2024, USDA OCE stated that it had not revised, and did not have plans to revise, its internal review process to ensure the baselines in its analysis are representative since the publication of GAO's report in November 2021. GAO contacted USDA regarding the status of this recommendation in March 2025 and March 2026 but has not received a response.
|