Retirement Security: Income and Wealth Disparities Continue through Old Age
Fast Facts
Income and wealth inequality in the United States have increased over the last several decades. We looked at whether these trends continue for older Americans as they age.
We compared income and wealth for all older households from 1989 through 2016 and found households in the top 20% saw disproportionately greater gains than other households.
We also looked at income and wealth for a group of older Americans as they aged. We found disparities in income decreased, possibly due to the transition from working to retirement. Disparities in wealth increased, perhaps because of significant differences in the size of some assets, such as home equity.

Money in hands
Highlights
What GAO Found
Disparities in income and wealth among older households have become greater over the past 3 decades, according to GAO's analysis of Survey of Consumer Finances (SCF) data. GAO divided older households into five groups (quintiles) based on their income and wealth. Each year of data in the analysis, and, thus, each quintile, included different sets of households over time. Average income and wealth was generally higher over time (see fig. 1 for average income), disproportionately so for the top quintile (top 20 percent). For example, in 2016, households in the top quintile had estimated average income of $398,000, compared to about $53,000 for the middle quintile and about $14,000 for the bottom quintile. GAO also found that for quintiles with lower wealth, future income from Social Security and defined benefit pensions provide a relatively significant portion of resources in retirement for those who expect such income.
Figure 1: Estimated Average Household Income of Older Households by Income Quintiles, 1989 to 2016
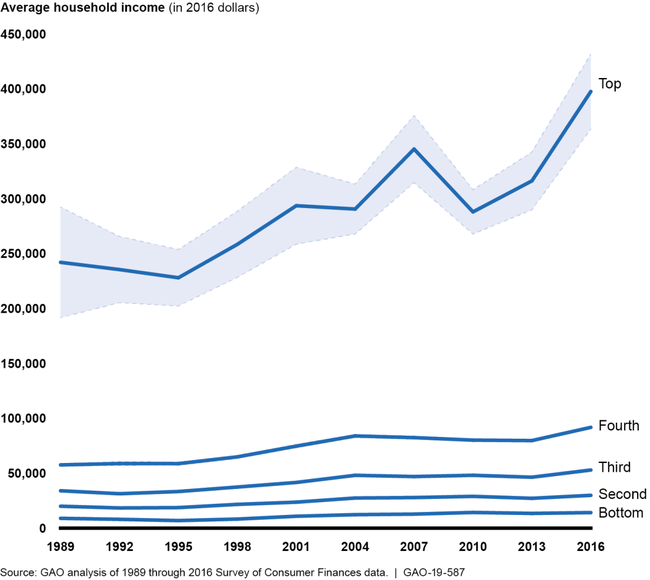
Notes: Income is aggregated across all sources, such as wages, Social Security benefits, or withdrawals from retirement savings accounts. Averages represent mean estimates. The shaded portions of the figure represent 95 percent confidence intervals; the intervals for some quintiles are less visible because they are very narrow. The Survey of Consumer Finances is conducted every 3 years. Older households are those where the survey respondents or any spouses or partners were aged 55 or older in the year of the survey. GAO ranked these households by their income and broke them into five equally sized groups, or quintiles. Each year of data in our analysis, and, therefore, each quintile included different sets of households over time.
A substantial number of older Americans born from 1931 through 1941 lived at least into their 70s or early 80s, according to GAO's analysis of data from the Health and Retirement Study (HRS), a nationally representive survey which follows the same individuals over time. GAO divided individuals born from 1931 through 1941 into quintiles based on their mid-career household earnings using records from the Social Security Administration. GAO's analysis, as well as that of other researchers, shows that differences in income, wealth, and demographic characteristics were associated with disparities in longevity. However, even with these disparities, we found a substantial number of people in the sample were alive in 2014, including those with characteristics associated with reduced average longevity, such as low earnings (see fig. 2) and low educational attainment. Taken all together, individuals may live a long time, even individuals with factors associated with lower longevity, such as low income or education. Those with fewer resources in retirement who live a long time may have to rely primarily on Social Security or safety net programs.
Figure 2: Estimated Proportion of Older Americans Ages 51 to 61 in 1992 Still Living in 2014, by Mid-Career Household Earnings
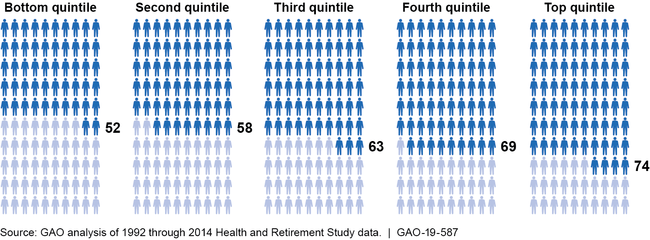
Notes: Older Americans ages 51 to 61 in 1992 were ages 73 to 83 in 2014. GAO defined mid-career household earnings based on earnings reported to the Social Security Administration for years when the survey respondents were ages 41 through 50, as well the earnings of their spouses or partners during those years if the respondents were part of a couple in 1992. GAO ranked these households by their mid-career household earnings and broke them into five equally sized groups, or quintiles. The proportion of individuals alive in 2014 was estimated using a Kaplan-Meier survival analysis.
GAO's analysis of HRS data also found that disparities in household income decreased while disparities in wealth persisted as a cohort of older Americans aged from approximately their 50s into their 70s or early 80s. Income disparities decreased between higher- and lower-earning households because higher-earning households saw larger drops in income over time, indicating the possible transition from working to retirement. For example, we estimated median income for the top mid-career earnings group decreased by 53 percent while estimated median income for the bottom earnings group decreased by 36 percent over the same period. Wealth remained relatively steady for households in the bottom three earnings groups over the time period GAO examined, while households in the top two earnings groups experienced larger fluctuations in wealth. GAO estimated that median retirement account balances and median home equity increased across earnings groups for households that had these assets. However, the continued wealth disparities may be due to significant differences in the median value of retirement accounts and home equity between higher- and lower-earning households. GAO also found that white households in the bottom two earnings groups had higher estimated median incomes, and white households in all earnings groups generally had greater estimated median wealth, than racial minority households in those earnings groups. In addition, within each earnings group, households headed by someone with at least some college education generally had higher median incomes and wealth than households headed by someone who did not attend college.
Why GAO Did This Study
Income and wealth inequality in the United States have increased over the last several decades. At the same time, life expectancy has been rising, although not uniformly across the U.S. population. Taken together, these trends may have significant effects on Americans' financial security in retirement.
GAO was asked to examine the distribution of income and wealth among older Americans, as well as its association with longevity, and identify the implication that these trends may have on retirement security. This report examines (1) the distributions of income and wealth among all older Americans over time; (2) the association between income, wealth, and longevity among older Americans; and (3) how the distributions of income and wealth changed over time for a cohort of individuals as they aged. To conduct this work, GAO analyzed data from two nationally representative surveys: the SCF, using data from 1989 through 2016, and the HRS. GAO used 1992 through 2014 HRS data linked to earnings records from the Social Security Administration. While preliminary 2016 HRS data are available, GAO used 2014 data, which contain more complete information for GAO's analysis. GAO also reviewed studies and interviewed researchers to further analyze the relationships between income, wealth, longevity, and retirement security.
For more information, contact Charles A. Jeszeck at (202) 512-7215 or jeszeckc@gao.gov.